


 Job Shop
Job Shop
Custom product/ one off
Design > Calculate > Quote > Source > Make > Deliver
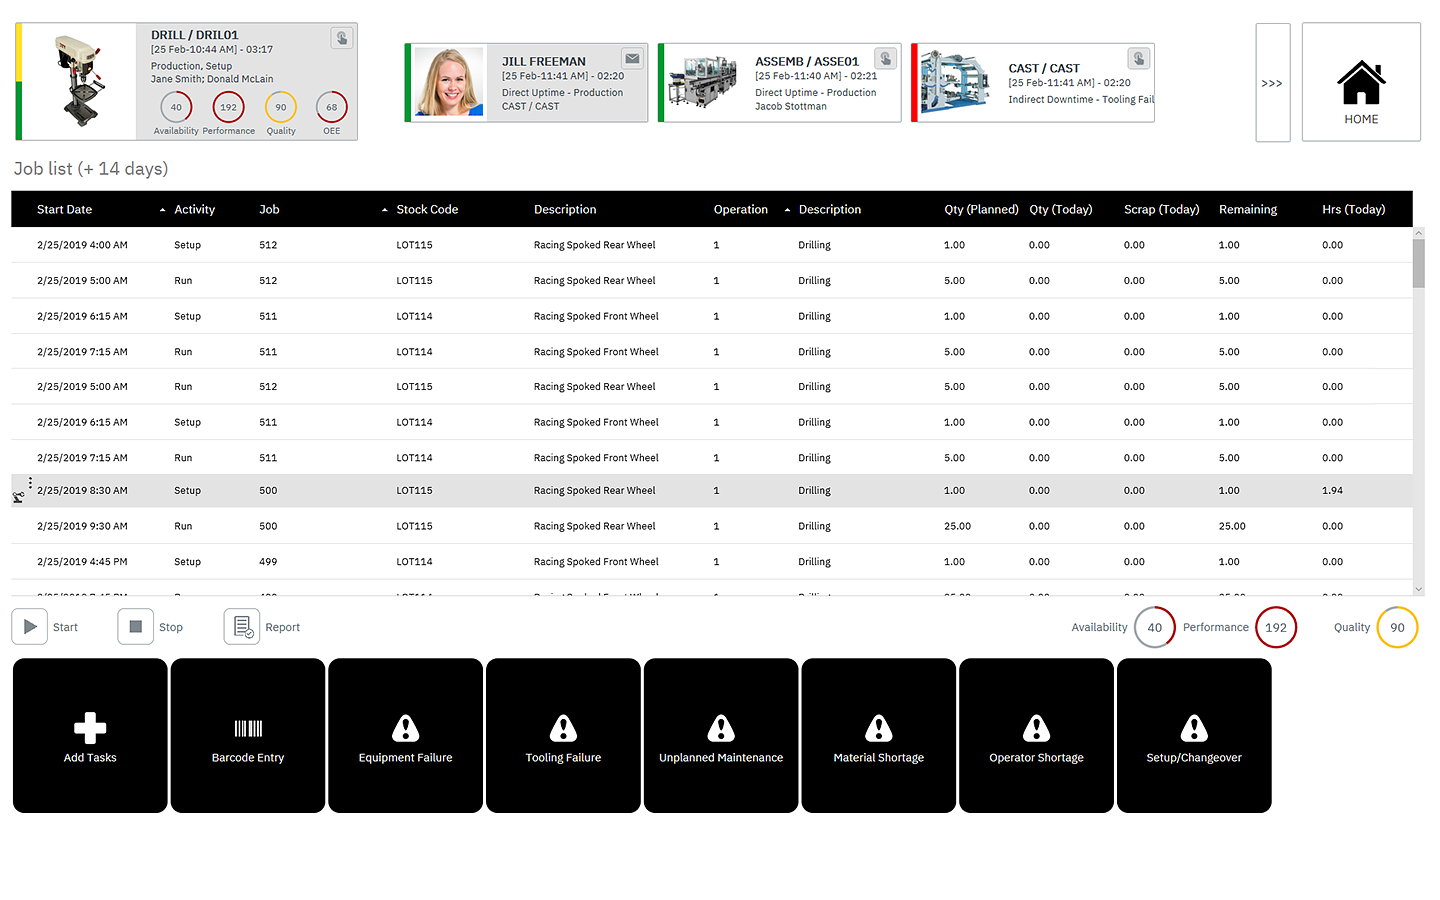
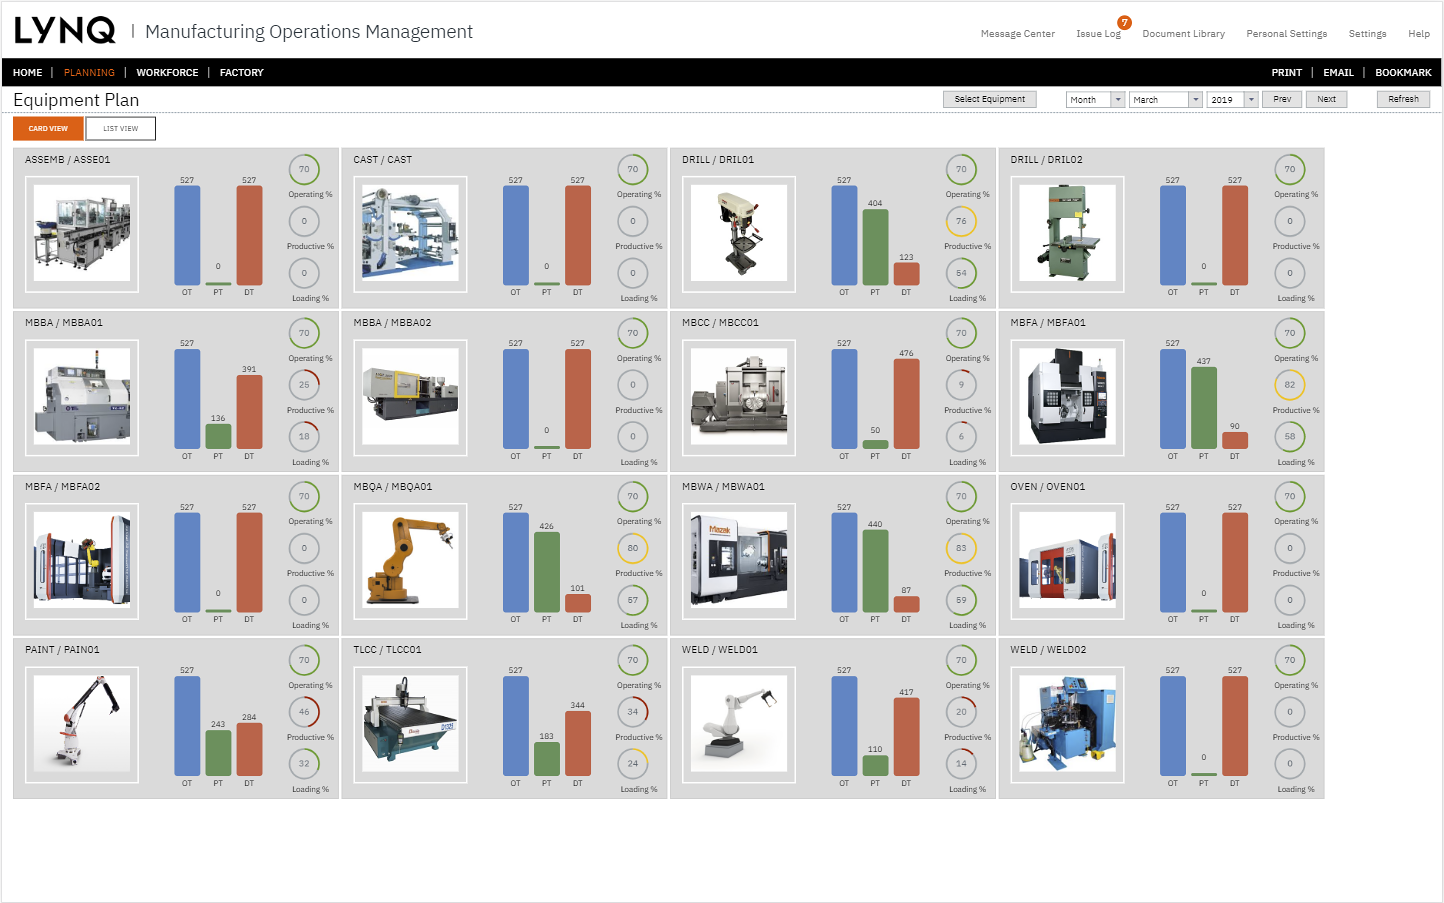
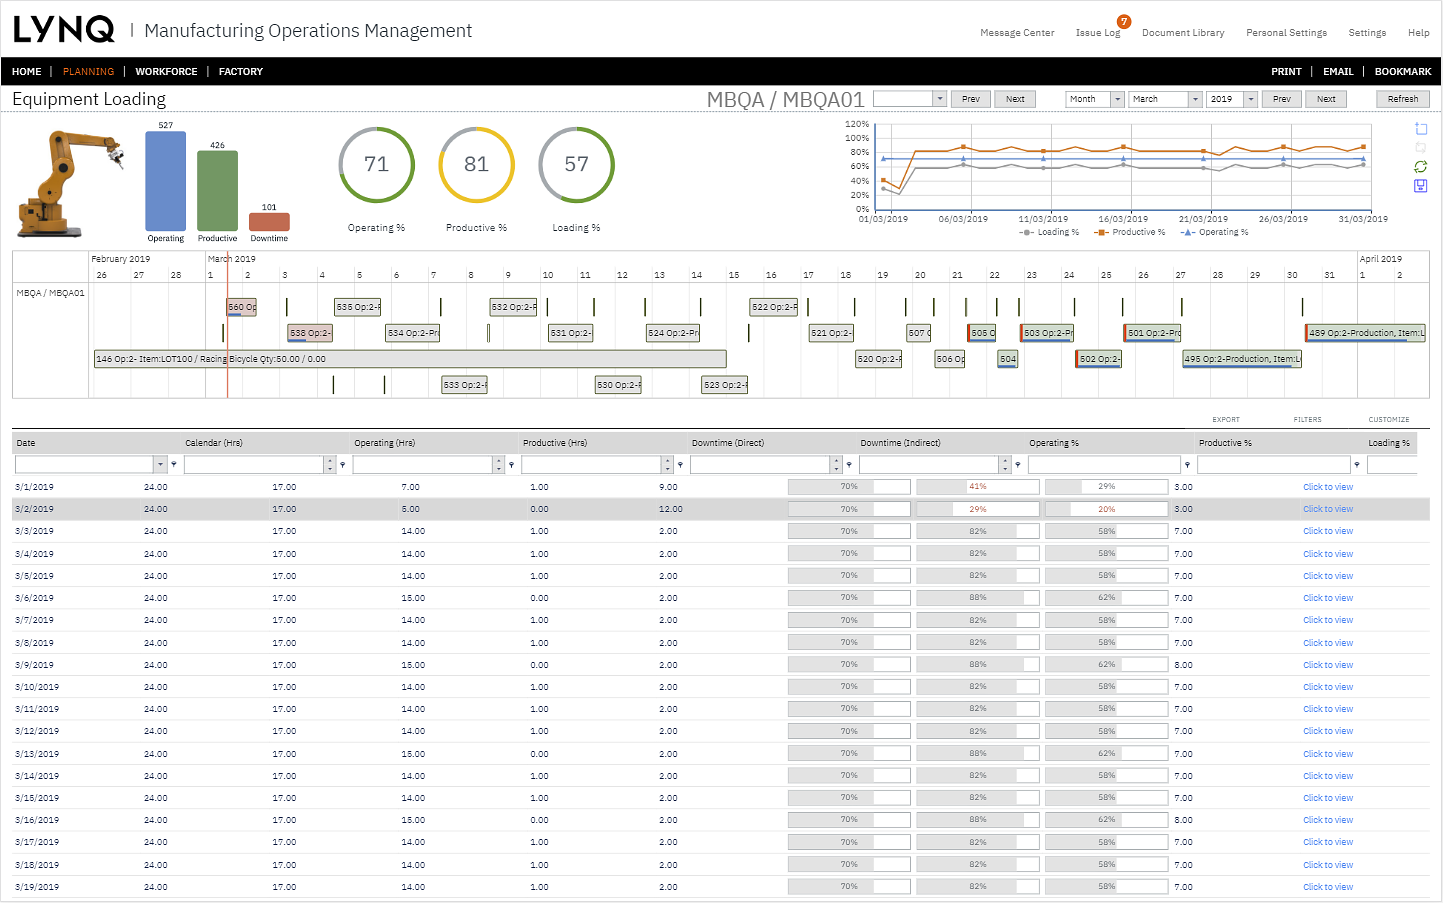
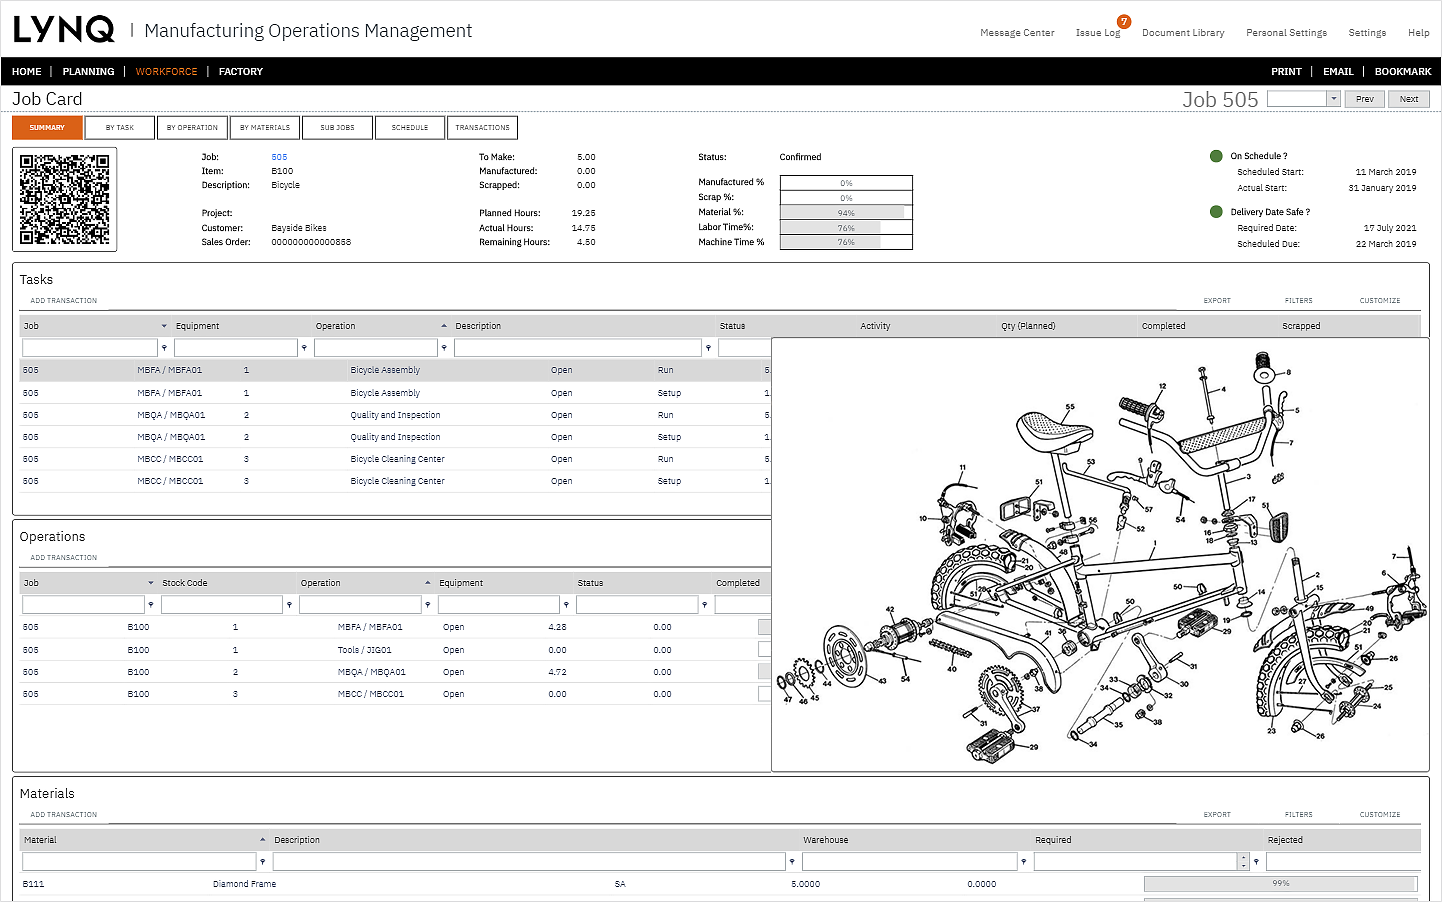
- Capable to Promise – ability to determine the delivery date of potential orders by overlaying them on the existing plan
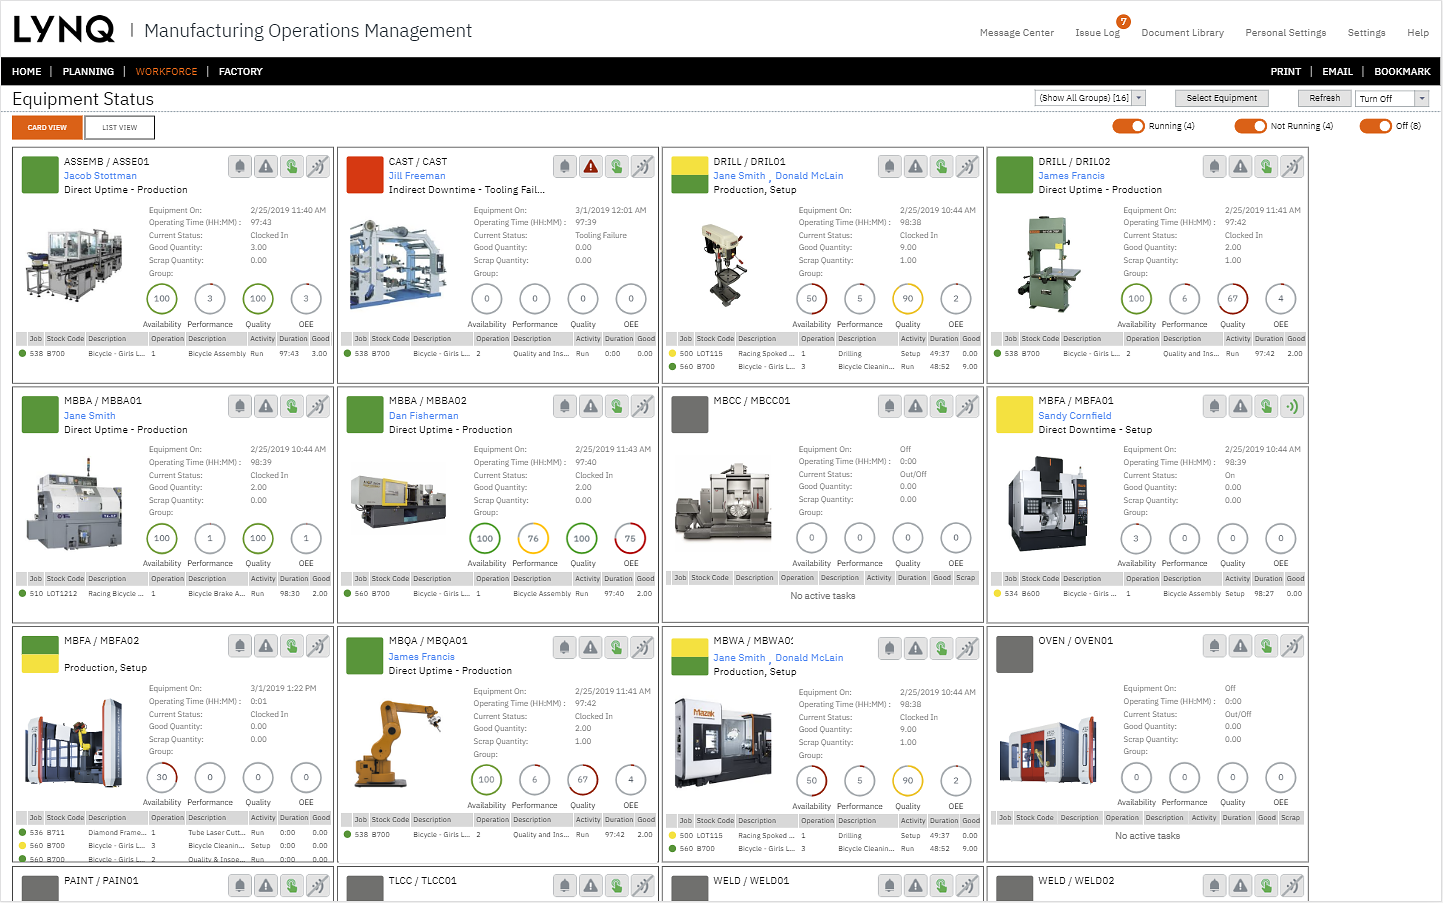
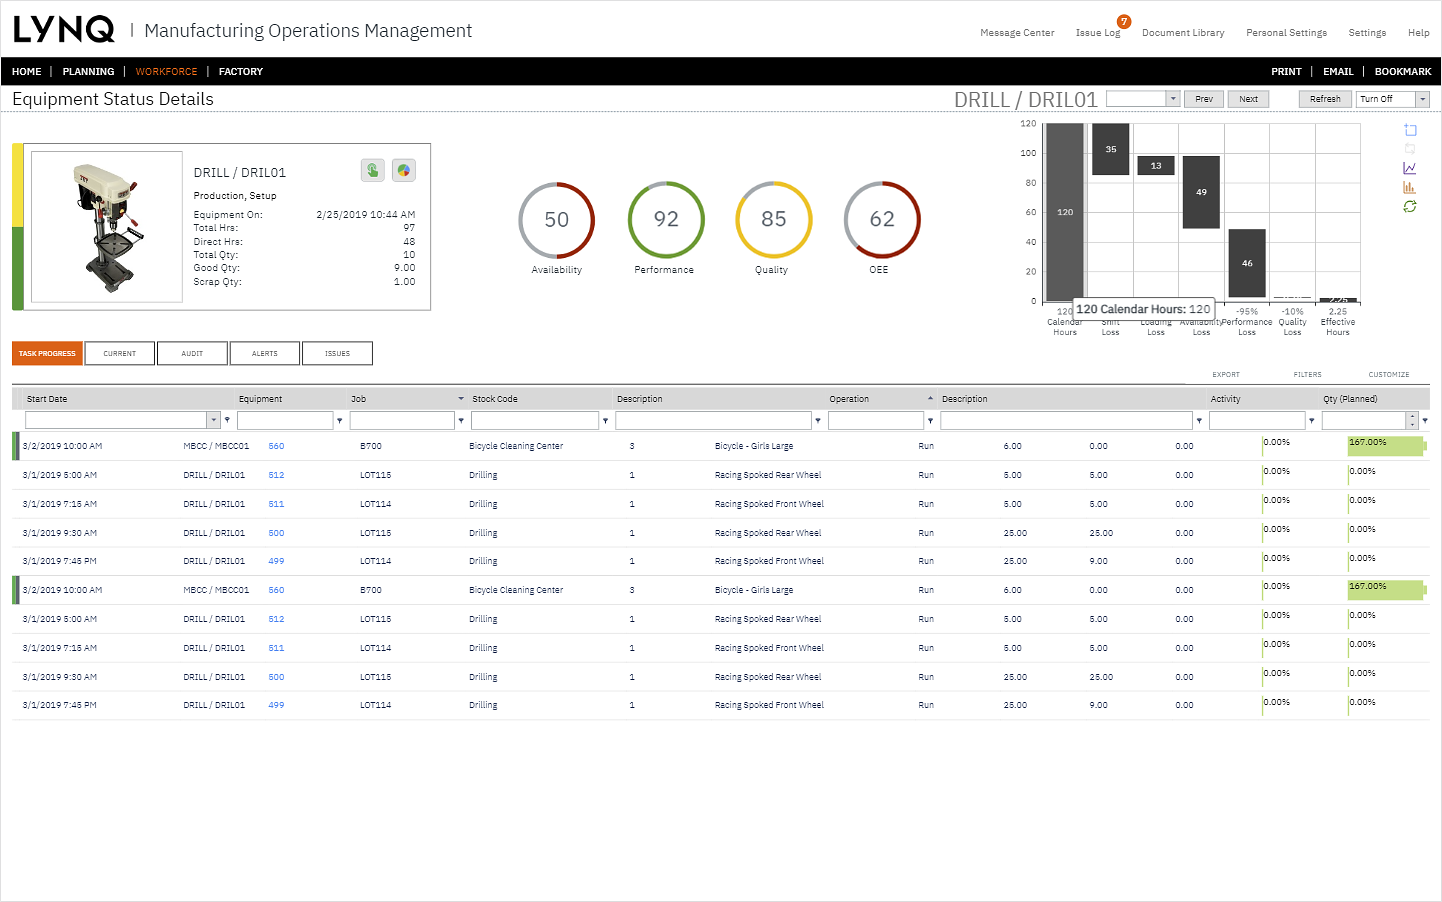
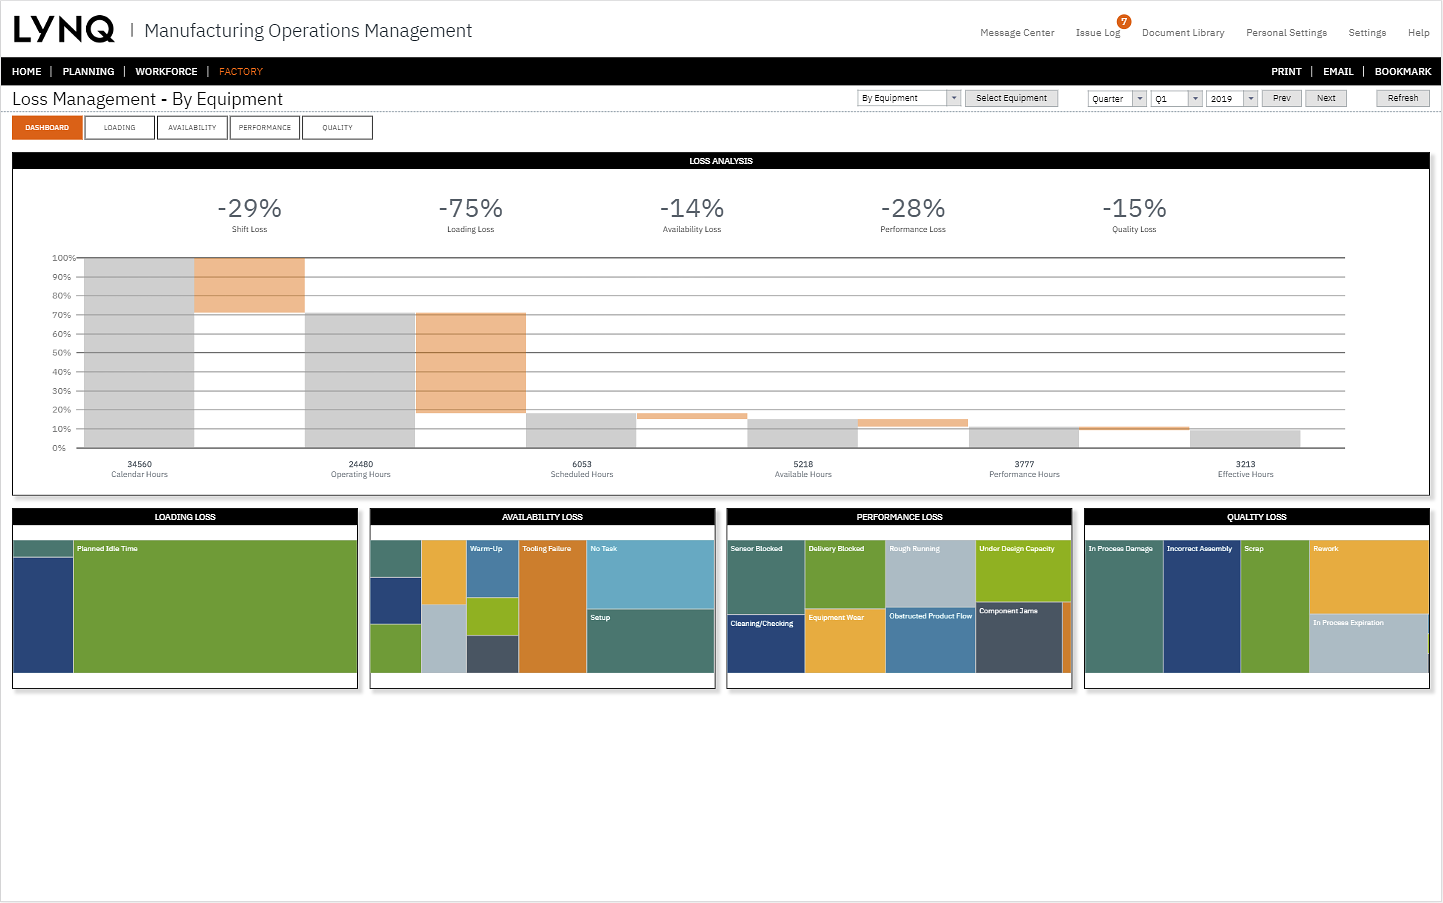
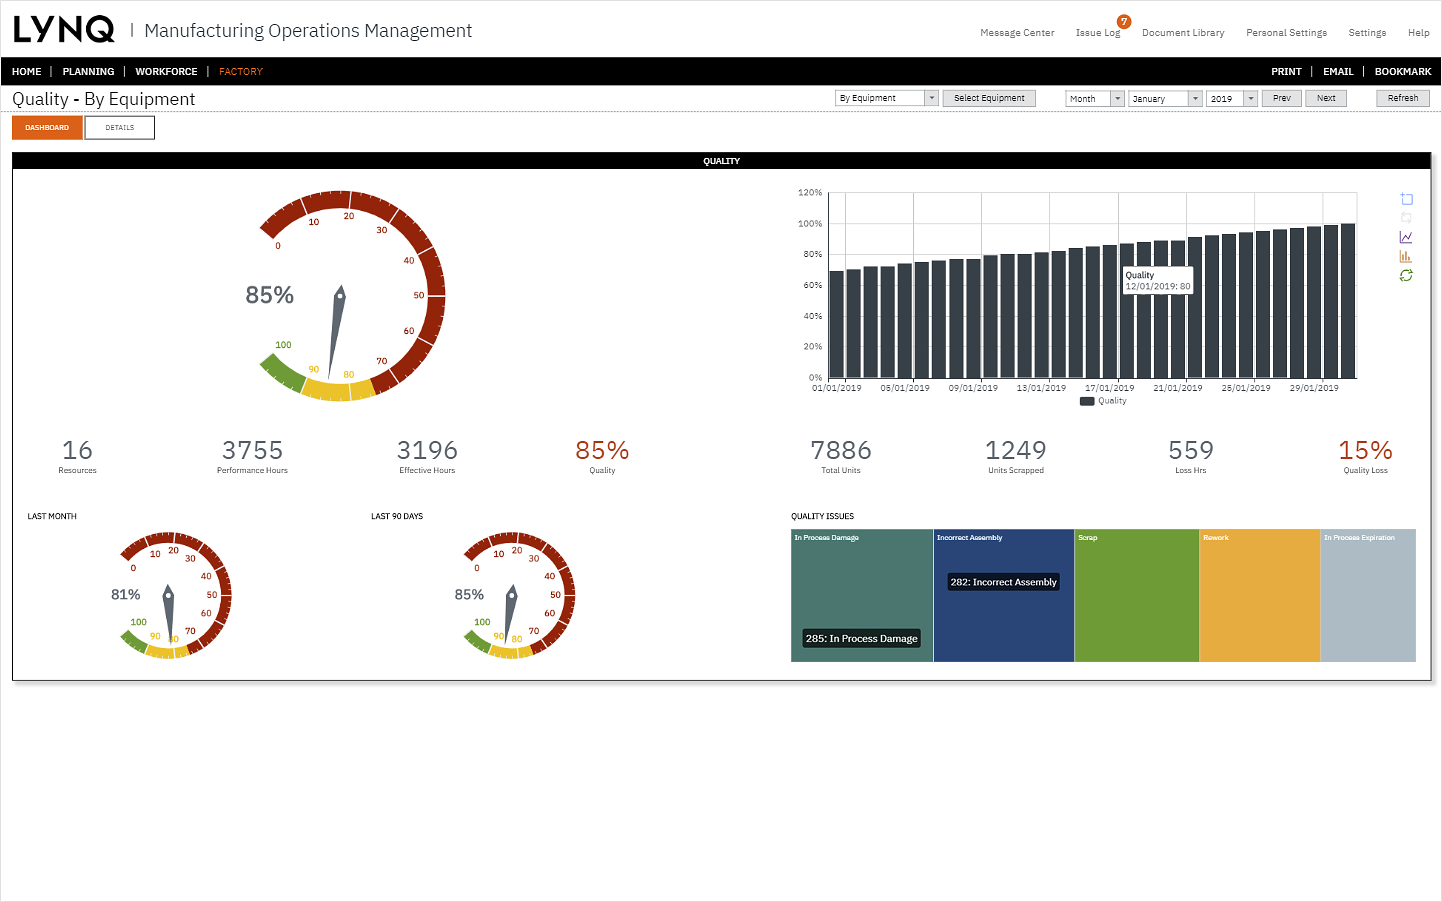
- Accurate job costs – ability to collect data easily and accurately to determine accurate job status and costs for margin and/or profit analysis
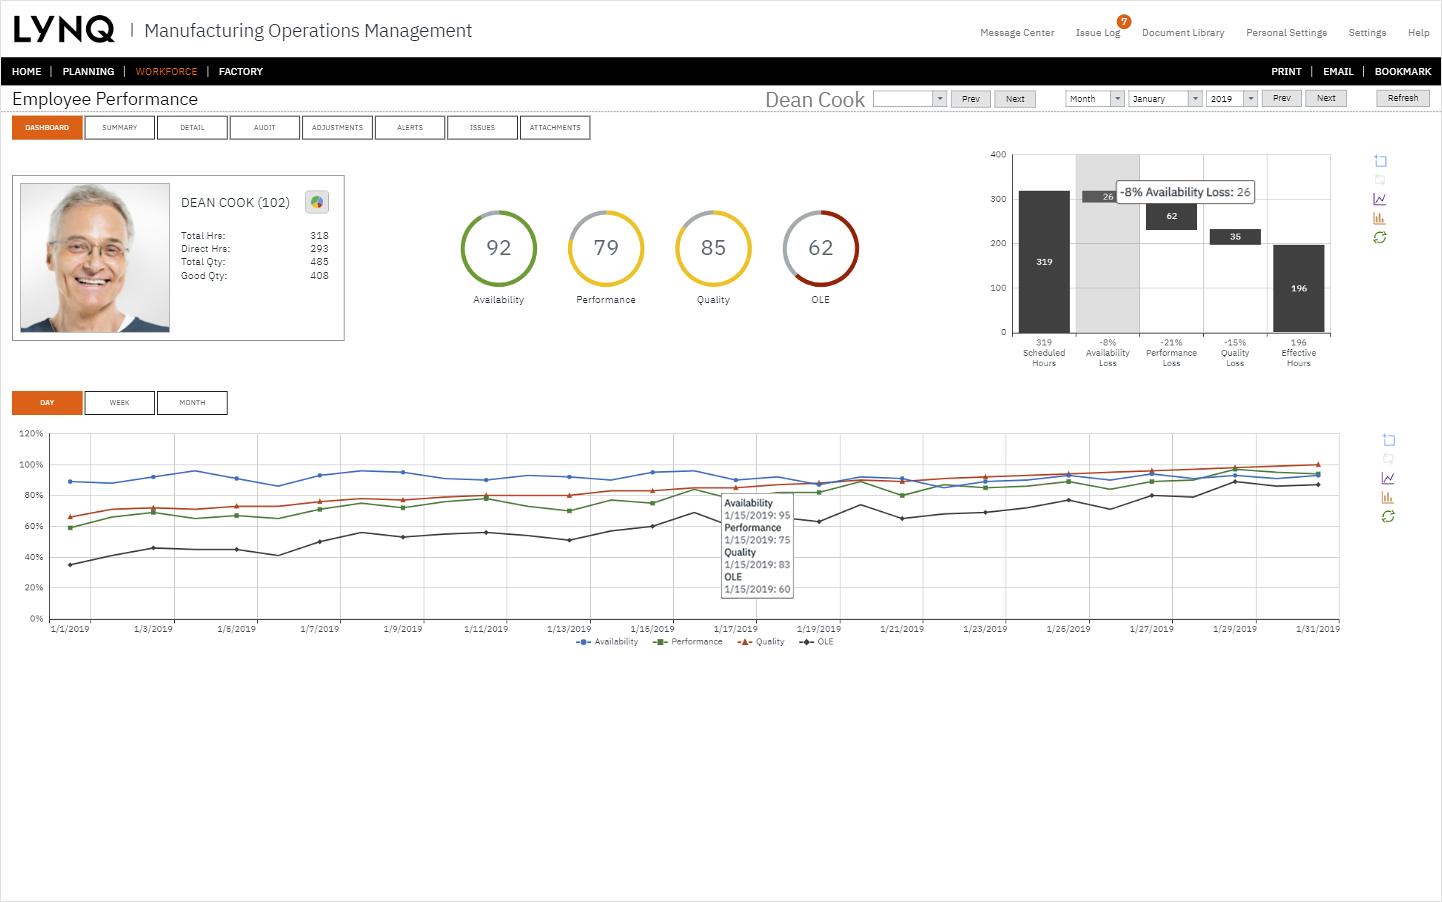
- Employee utilisation – ability to analyse and make best use of high cost, skilled employees (OLE)